
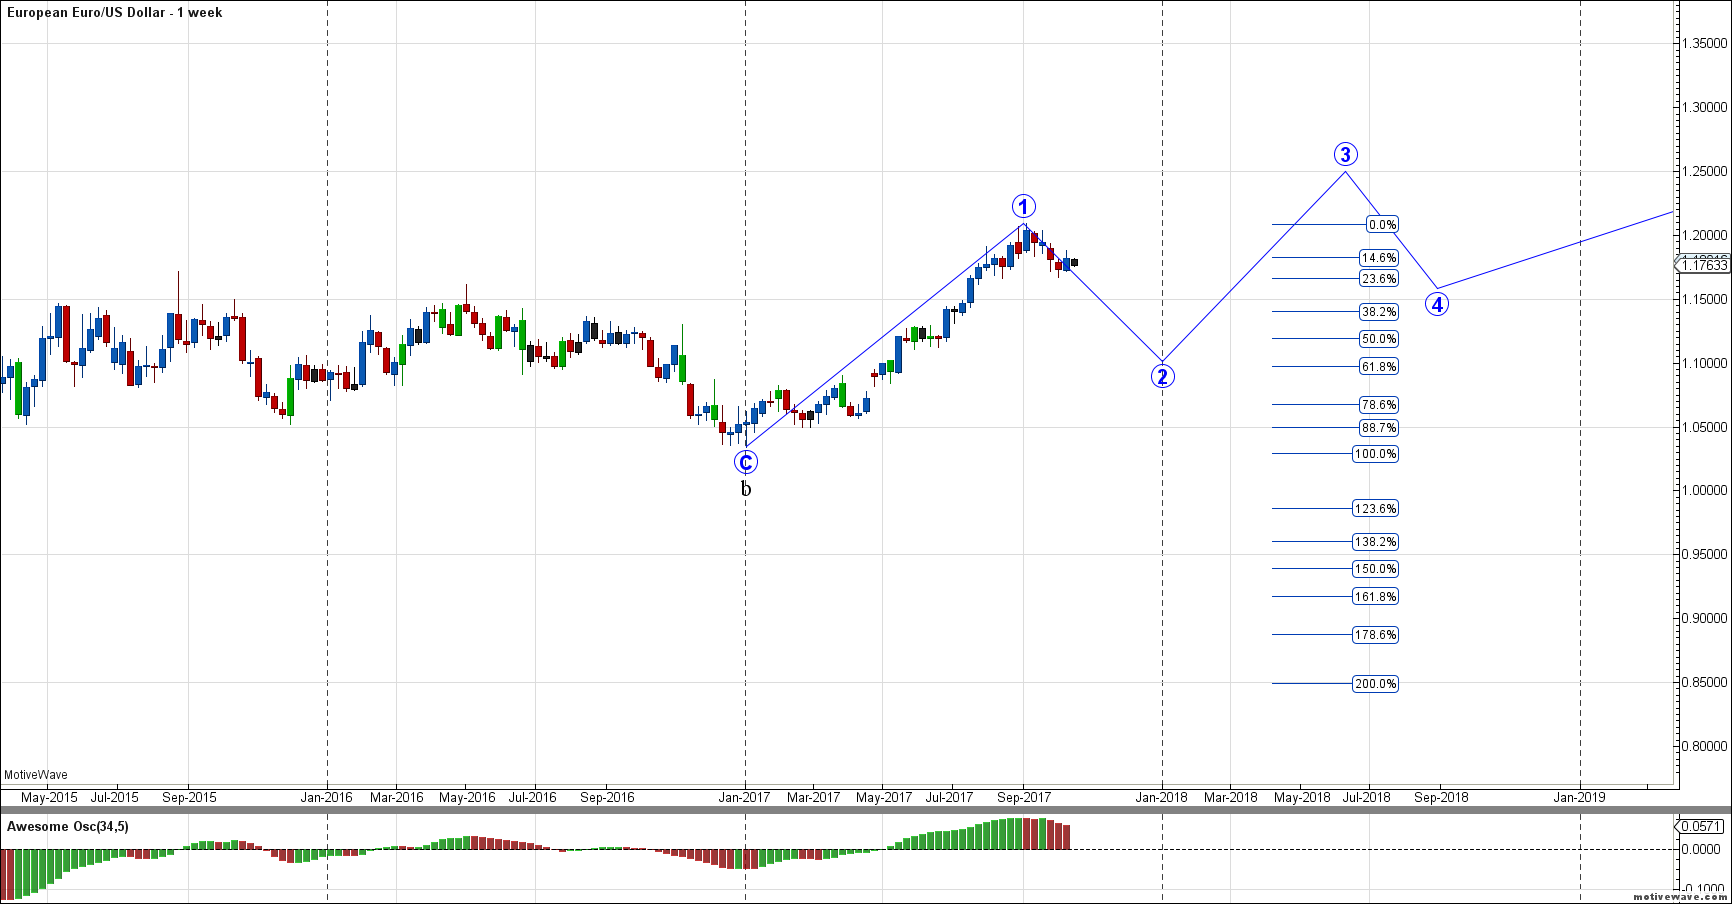
 In this Post we will analysis EURUSD for long term. EURUSD was in sideways since May 2015, which was in fact a flat correction. Prices starts to bounce back in Jan 2017 from $1.05. If you look at the weekly chart this was completion of Wave b in Cycle and wave C in Primary. Completion of wave b in Cycle degree indicates uptrend of wave c of Cycle Degree. If we are to trade in the direction of the trend, then this is the wave we should be using. However we as human do not have that much patient to wait for trade entry. We need to look at lower time frame Daily.
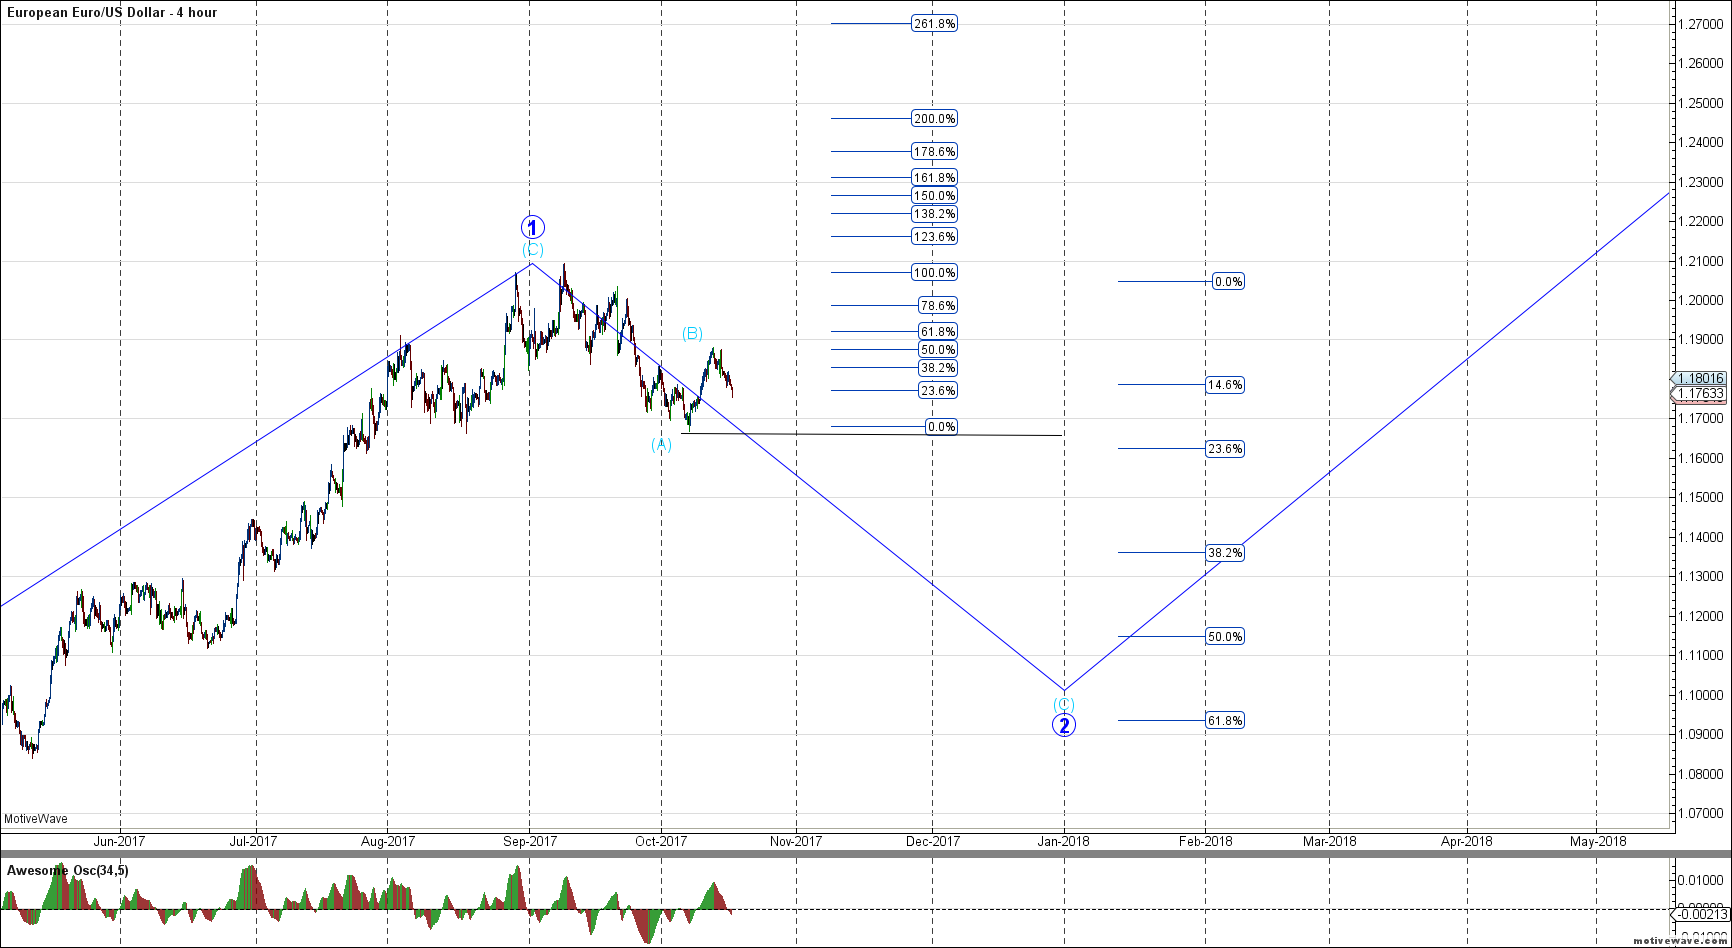
 On Daily chart it clear that we are in Wave 2 of wave c. Wave 1 of Wave c took almost 6 months to complete. If we want to wait for wave 2 to be complete we may have wait till end of 1st quarter of 2018. So we will consider wave [2] as our current major trend in Daily time frame, and this is bearish trend. So till Wave 2 is finished we will trade short in EURUSD. The question is how to find right Entry and Stop loss to maximize our analysis on this pair. It is very simple, look at the sub structure of wave 2 and find entry for wave 3 of wave (C) of wave [2].
 Going to smaller time frame will help you to identify your entry . For me the conservative entry is below the Wave (A) of wave(c). My first exit will be around 50% of Fibonacci, my second exit will be at 61.8% Fibonacci. The structure is very clear and we need patient for fulfillment of our order. For those who are impatient, they can find entry in wave (iii) of (B) around 1.17533 with Stop Loss just above of last counter wave (ii)
[/et_pb_text][/et_pb_column][/et_pb_row][/et_pb_section]